
So, what is margin of error in statistics? The margin of error (MOE) for a survey indicates how closely the comparison of survey results to the actual population value is made. For instance, a 3% error margin study shows that 72% of respondents choose Brand A over Brand B. In this instance, the actual population percentage that favors Brand A is probably between 69 % and 75 %, or 72 % ± 3%.
A margin of error in a random survey sample is a statistical measurement that considers the discrepancy between actual and anticipated results. You may determine the degree of unpredictability in data and research results using the margin of error.
Typically, a wider margin of error indicates that the data sets may not be trustworthy for your research or survey results. On the other hand, a smaller margin of error denotes that the results accurately reflect the research entire population.
How Do You Explain Margin of Error in Statistics?
In statistics, the margin of error is the level of standard error in the findings of surveys using random samples. A wider margin of error in statistics denotes a reduced likelihood of relying on a survey’s or poll’s findings, meaning that there will be less confidence in the results’ ability to reflect a population accurately. Therefore, it is a crucial tool for market research since it shows the confidence levels that should be placed in survey data by the researchers.
A confidence interval is a measure of how unpredictable a given statistic is. It is typically used in conjunction with the margin of error to indicate how confident a statistician is in determining whether or not the findings of an online survey or poll are worthy of representing the entire population.
There will be some uncertainty when we choose a representative sample to estimate the entire population. However, the genuine statistic must be deduced from the sample statistic. However, it suggests that our estimate will be relatively accurate. This estimate is improved further by taking the margin of error into account.
Importance of the Margin of Error in Surveys, Research, and Polls

- It Helps in Obtaining Reliable Results
The margin of error considers discrepancies between a study sample’s findings and the target population. The difference between actual and estimated findings is typically more considerable than the margin of error, further indicating that the survey results are less likely to be representative of the entire population.
- It Enables Researchers to Assess the Sample’s Representativeness
A small margin of error indicates that the sample population accurately represents the studied population.
When working with a sizable population of interest, it is impossible to get information from every variable. Instead, the researcher must choose a sample to accurately reflect all the subgroups in the original population of interest.
The final findings of the poll, survey, or research won’t accurately reflect what would have happened in the original population, excluding some categories from the sample population.
- It Can Help You Calculate Your Data Sets’ Confidence Level and Confidence Interval
You may quickly determine the confidence interval for your data set if you are aware of your survey’s margin of error and the value of your observed score.
In addition, there is a grouping of a parameter’s statistically possible values into a confidence interval. Contrarily, confidence level assesses the degree to which your results of the study or survey results are accurate given the information at hand.
What Does the Margin of Error Show?
What does it indicate when the margin of error for your data is a specific percentage? What’s more, how do you explain this to a non-statistics-savvy audience in layman’s terms?
The first point you should make clear is that the margin of error accounts for the most significant discrepancy between the results of your sample size and those of the relevant population. Therefore, if your margin of error is 3%, your target population’s actual results could be 3% higher or lower than the projected figure.
Determining Your Sample Size
When designing a survey that will produce reliable results, especially when utilizing the data to inform critical business choices, choosing the appropriate sample size is essential.
The calculation process of the sample size uses The number of participants representing the entire population. For example, two thousand people might be a representative sample of the UK workforce.
You won’t receive accurate findings if you select a sample too small. However, the margin of error decreases with sample size. There is, of course, a trade-off because more significant sample sizes necessitate more expensive research.
How to Calculate the Margin of Error Formula?
Your margin for error, also known as your confidence interval, effectively defines how certain you may be that your sample results will match those obtained from survey research of the entire population.
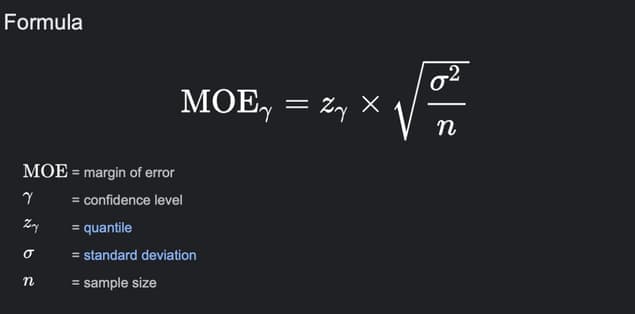
You can create your margin of error calculator by using the formula for the margin of error along with the z score table :
Formula – Z * ((p (1 – p)) / n)
What Is a Critical Value?
The split point in hypothesis testing, which decides whether the researcher accepts or rejects the null hypothesis, is a crucial parameter. The critical value divides the variables into distinct regions on a graph, including the rejection regions. Researchers utilize the critical value to identify the applicable ranges within the data sets while computing the margin of error.
What Is an Acceptable Margin of Error in Statistics?
Most survey researchers consider a margin of error acceptable if it falls between 4% and 8% at a 95 percent confidence level. Sample size, population size, and percentage all impact margin of error.
Although obtaining a small margin of error is crucial, getting a sample that is perfectly representative of the population is the real key to winning.
Factors That Affect Margin of Error
You should already understand the elements that primarily influence the margin of error based on everything we’ve covered up to this point. These elements are sample size, standard deviation, and confidence level.
As a result, changing the value of any of them will significantly impact the margin of error for your data. If your sample size increases from 1,000 to 10,000, for instance, your margin of error can also grow or shrink by a similar amount.
How to Reduce Margin of Error
1) Pick a bigger sample size to examine more data points in your data set; doing so can estimate the population parameter you measure more precisely.
2) To have a more accurate margin of error, reduce your confidence interval.
3) Use a one-sided confidence interval rather than a two-sided one because it has a smaller margin of error.
4) Make your data sets less variable, so the values are more uniform.
What Is Margin of Error in Statistics Example?
For instance, the quality and flavor of the wines served at wine tasting sessions held in vineyards depend on such factors. Depending on how well the customers receive them, these wines represent the overall production, and any comments about them apply to the entire operation.
The wine tasting will be successful when visitors are picked randomly and do not follow a pattern. Similar to how wine goes through a process to become delicious, visitors also go through a procedure to deliver results.
The measuring elements demonstrate if the wine bottles deserve to serve as an accurate representation of the entire winery’s output. For example, suppose a statistician estimates that the margin of error for the survey will be plus or minus 5% with a 93% confidence range. In addition, it means that if the conduction of polls of a vineyard visitor is 100 times, the results will vary by a percentage higher or lower.
If 60 people say, the wines were excellent in this instance. Given that the margin of error is plus or minus 5% and the confidence interval is 93 percent, it is reasonable to assume that out of 100 visitors, 55 or 65 will mention that the wines were “very nice.”
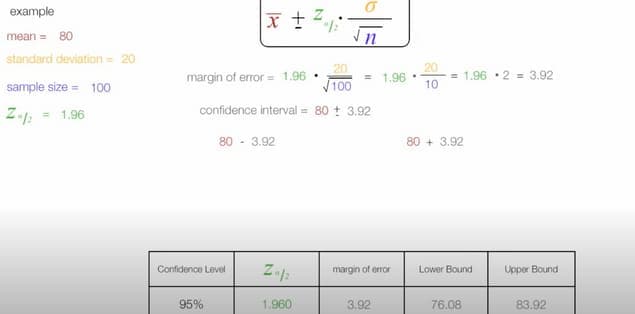
To further illustrate this, let’s use the example of a poll on volunteering. Of the 1000 responses, 500 agreed with the survey’s assertion that volunteering improves people’s lives. Determine the margin of error given a 95% confidence level.
Step 1: To determine P-hat, divide the total number of respondents by the proportion of survey participants who agreed with the statement. In this instance, 50% is equal to 500/1000.
Step 2: Locate the z-score corresponding to a 95% confidence level. Z score in this instance is 1.96.
Step 3: Use the formula Z * ((p (1 – p)) / n) to calculate by entering these numbers.
Step 4: convert to a percentage.
Final Words – What Is Margin of Error in Statistics?
This article covers the margin of error and its impact on the findings of any systematic inquiry. Considering the differences between your sample data and the target audience would be best because research is based on gathering samples from a population of interest. The best approach to do this is to determine the margin of error of your observation.