So, what is n in stats? Statistics is gathering data, classifying it, presenting it in a way that makes it understandable, and then conducting additional data analyses.
We often use symbols and short forms to determine various terms in statistics.
You might get confused between N and n, and continue reading to eliminate your confusion.
What Does n Denote in Stats?
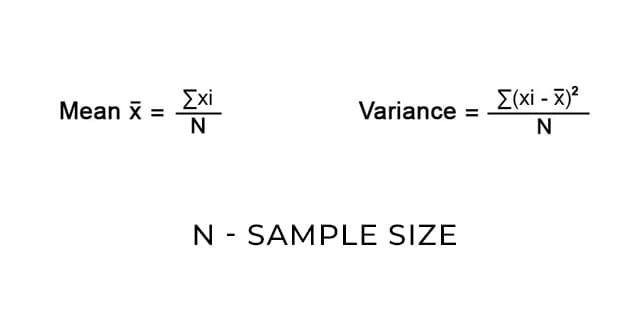
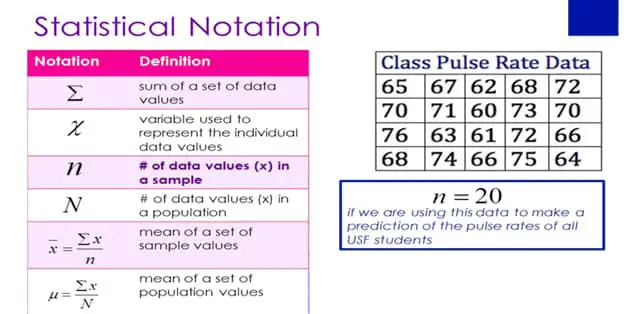
n denotes sample size in statistics, simply a portion of the population parameters chosen for a survey or experiment.
A fundamental part of statistics is presenting a sample size when evaluating your outcomes. The statistical acronym for sample size is n. Thus, the value n 120 denotes the 120 people in your sample statistics.
Let’s Take a survey on the preferred brands among dog owners as an illustration. Since it would be impractical or expensive to survey every one of the nation’s millions of dog owners, you choose a sample size instead. There could be thousands of owners. The total sample size represents the brand choice of all dog owners. So your sample will be a decent representative if you pick it carefully.
What Does N Denote in Stats?
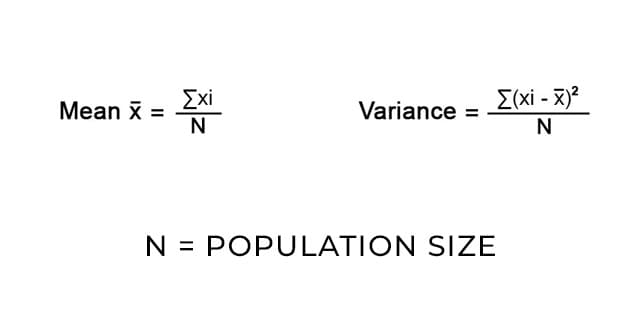
One widely accepted concept states that N generally means population size, and the letter n represents the sample size. However, some people think of N as the overall sample size and feel n as a portion of the sample.
Data on your study’s target strength, termed the population, could be a collection of people, things, occasions, businesses, etc. To come to conclusions, use population. The complete student body at a school is an example of a population.
In Probability, What Does The N Symbol Mean?
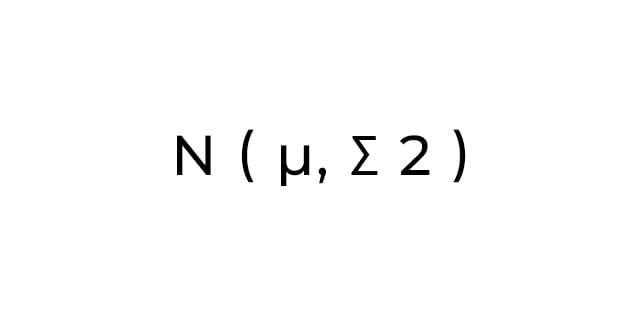
N ( μ, σ 2 ) means the Standard deviation and mean for a Normal distribution in a probability experiment.
Data near the mean are more likely to occur than data distant from the mean, according to the normal distribution, which is symmetric around the mean.
How Do You Find n in Statistics?
In statistics, a sample is a portion of the entire population. Using data from a sample, you can conclude a population proportion as a whole. An example of approximating a population’s standard deviation is using a sample’s standard deviation. One of the most difficult tasks in statistics is determining the sample size, which is dependent on several variables, including the size of your initial population.
Steps:
- If you have a small population, perform a survey. A “small” population will rely on your financial situation and availability. For instance, you might only have time to survey 1,000 students at a small private university in one day instead of a population of 10,000 students at a huge public university.
- Employ the sample size from a related study. There’s a good chance someone else has already conducted a study similar to yours. To look for a study, you’ll need access to academic databases (usually, your school or college will have access). One drawback is that you’ll depend on someone else to determine the sample proportion and size accurately. Any mistakes they made in their calculations will show up in your research.
- To determine your sample size, use a table. There is probably a table for your study if it is reasonably generic. If you have a clinical trial, for instance, you might be able to utilize a table from the fourth edition of the Sample Size Tables for Clinical Studies book by Machin et al.
- Make use of a sample size estimator. Many different calculators are available online, some simple and some more advanced and specialized. This calculator, for instance, is for a particular group –or cluster-randomized trial (GRTs). Apply a formula. Depending on the information you have about your population, you can employ various formulas. Use the methods below if you are aware of some population-related parameters, such as the standard deviation of your population. Use Slovin’s formula if you don’t know much about your population size.
What is n in Statistics Example?
For instance, your sample size is 100 if you analyze 100 samples of seawater for oil residue. The sample size is 20,000 persons if you survey 20,000 people for anxiety symptoms. The obvious benefit of bigger sample sizes is that they provide researchers access to more data, yet, large sample-size experiments demand greater financial and time investments.
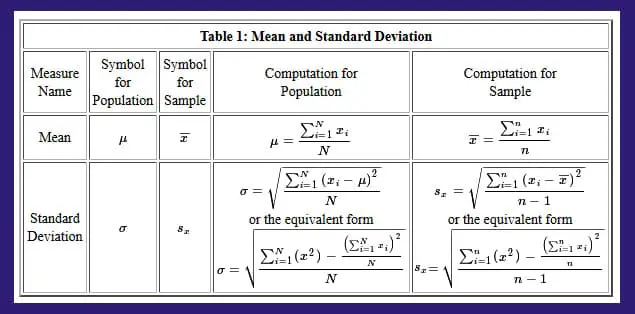
The mean is the average value of quality among examined samples that we can determine with the help of larger sample sizes—the precision of the mean increases with sample size.
For instance, if you discover that the mean height among 40 employees is 5 feet, 4 inches, but the mean height among 100 employees is 5 feet, 3 inches, the second measurement is a stronger indicator of an individual’s average height because you’re evaluating far more subjects.
Researchers can more easily identify outliers by measuring the mean. For example, an outlier is a data point that deviates significantly from the mean value and might serve as a research focus. Therefore, a person who is 6 feet and 8 inches tall would be an outlier in terms of the height based on the mean.
Final Words – what is n in stats
Statistically, a significant sample size is not necessary for customer satisfaction surveys. Therefore, these surveys must be precise and provide more detailed results. You must thoroughly evaluate each response a consumer has provided in a customer satisfaction survey. Positive or negative feedback is all valuable.
Statistically, a meaningful sample size is very helpful for market research. These market research studies assist in learning fresh details about your target market and its consumers. You will get the most recent data about your target market and the consumers who would use your services or purchase your goods with the help of this survey.